In my Serious Stats blog I have a new post on providing CIs for a difference between independent R square coefficients.You can find the post there or go direct to the function hosted on RPubs. I have been experimenting with knitr but can't yet ge...

In my Serious Stats blog I have a new post on providing CIs for a difference between independent R square coefficients.You can find the post there or go direct to the function hosted on RPubs. I have been experimenting with knitr but can't yet ge...
ShinyStan is great, but I don’t always use it because when you call it from R, it freezes up your R session until you close the ShinyStan window. But it turns out that it doesn’t have to be that way. Imad explains: You can open up a new session via the RStudio menu bar (Session […] The post Visualizing your fitted Stan model using ShinyStan without interfering with your Rstudio…
When we use the words artificial intelligence, we typically mean artificial machine intelligence, training machines to act like human beings. What is actually happening is the opposite - we are developing artificial human intelligence, as in, humans are being trained to think like machines. Example 1: I recently called a cab company and told them I was at Union Square. The despatcher was taking a long time to respond, and…

I'm looking for great teachers of Bayesian statistics! Have you taught a course in Bayesian statistics? Have you used DBDA2E? Are you an enthusiastic teacher with very high evaluations?Do you have an abiding interest in a range of applied sta...

In an earlier blog post I provided R code for a CI of a difference in R square for dependent and non-dependent correlations. This was based on a paper by Zou (2007). That paper also provides a method for calculating the CI of a difference in independent R square coefficients based on the limits of […]

Phil Price recently wrote two much-argued-about posts here and here on the yimby (“yes in my backyard”) movement in San Francisco. One of the people disagreeing with him is Sonja Trauss, who writes: Phil makes a pretty basic mistake of reasoning in his post, namely, that the high income residents of the proposed new housing […] The post San Francisco housing debate: A yimby responds appeared first on Statistical Modeling,…

The nnetar function in the forecast package for R fits a neural network model to a time series with lagged values of the time series as inputs (and possibly some other exogenous inputs). So it is a nonlinear autogressive model, and it is not possible t...

Don Green points us to this quantitative/qualitative meta-analysis he did with Betsy Levy Paluck and Seth Green. The paper begins: This paper evaluates the state of contact hypothesis research from a policy perspective. Building on Pettigrew and Tropp’s (2006) influential meta-analysis, we assemble all intergroup contact studies that feature random assignment and delayed outcome measures, […] The post The Other Side of the Night appeared first on Statistical Modeling, Causal…
This post is by Keith. In this post I try to be more concise and direct about what I found of value in Laura Arnold’s TEDx talk that I recently blogged about here. Primarily it was the disclosure from someone who could afford to buy good evidence (and experts to assess it) that they did not think good […] The post Take two on Laura Arnold’s TEDx talk. appeared first on Statistical Modeling,…

X informs me of a new effort, “Peer community in . . .”, which describes itself as “a free recommendation process of published and unpublished scientific papers.” So far this exists in only one field, Evolutionary Biology. But this looks like a great idea and I expect it will soon exist in statistics, political science, […] The post PCI Statistics: A preprint review peer community in statistics appeared first on…
Recently, I noted how we have to learn to hate defaults in data visualization software. I was reminded again of this point when reviewing this submission from long-time reader & contributor Chris P. The chart is included in this Medium...
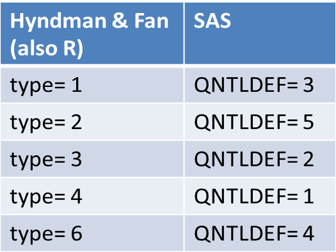
According to Hyndman and Fan ("Sample Quantiles in Statistical Packages," TAS, 1996), there are nine definitions of sample quantiles that commonly appear in statistical software packages. Hyndman and Fan identify three definitions that are based on rounding and six methods that are based on linear interpolation. This blog post shows [...] The post Sample quantiles: A comparison of 9 definitions appeared first on The DO Loop.
Doug Puett writes: I am a 2012 QMSS [Columbia University Quantitative Methods in Social Sciences] grad who is currently trying to build a Data Science/Quantitative UX team, and was hoping for some advice. I am finding myself having a hard time finding people who are really interested in understanding people and who especially are excited […] The post This company wants to hire people who can program in R or…

Tidy data at its heart is a set of three rules for organizing a data set: Each variable forms a column. Each observation forms a row. Each type of observational unit forms a table. This is an incredibly useful abstraction for thinking about organizin...
My blog was down for almost a couple of weeks due to some changes with how google handles account payments and blogger in particular. Sorry about that.

Recently, 'Michael' placed the following comment on one of my posts:"Thanks for sharing this interesting list of articles! I'm wondering, how do you go about finding these types of articles to read? Are you a subscriber to these publications/do you reg...

A few days ago I shared my reactions to an op-ed by developmental psychologist Alison Gopnik. Gopnik replied: As a regular reader of your blog, I thought you and your readers might be interested in a response to your very fair comments. In the original draft I had an extra few paragraphs (below) that speak […] The post How is a politician different from a 4-year-old? appeared first on Statistical…
Recently I was privileged to sit on the committee that selects the winner of the Karl Pearson Prize. KP was, of course, an early mathematical statistician, famous for many commonly-used statistical methods and tools including histograms, the correlatio...
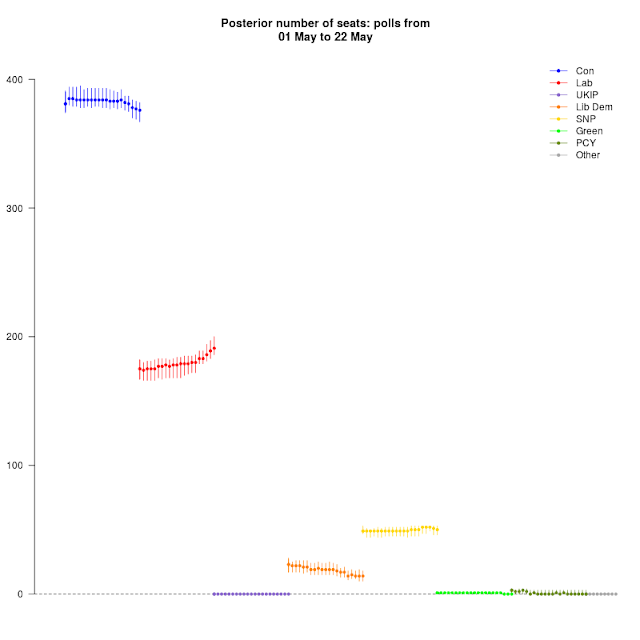
This is going to be a very short post. I've been again following the latest polls and have updated my election forecast model $-$ nothing has changed in the general structure, only new data coming as the campaigns evolve.The dynamic forecast (which con...
Top-down design means designing from the client application programmer interface (API) down to the code. The API lays out a precise functional specification, which says what the code will do, not how it will do it. Coding bottom up means coding the lowest-level foundations first, testing them, then continuing to build. Sometimes this requires dropping […] The post Design top down, Code bottom up appeared first on Statistical Modeling, Causal…

Here's a speakers' photo from last week's Penn conference, Big Data in Dynamic Predictive Econometric Modeling. Click through to find the program, copies of papers and slides, a participant list, and a few more photos. A good and productive...
I wrote this article for a sociology journal: Science is in crisis. Any doubt about this status has surely been been dispelled by the loud assurances to the contrary by various authority figures who are deeply invested in the current system and have written things such as, “Psychology is not in crisis, contrary to popular […] The post How to think scientifically about scientists’ proposals for fixing science appeared first…
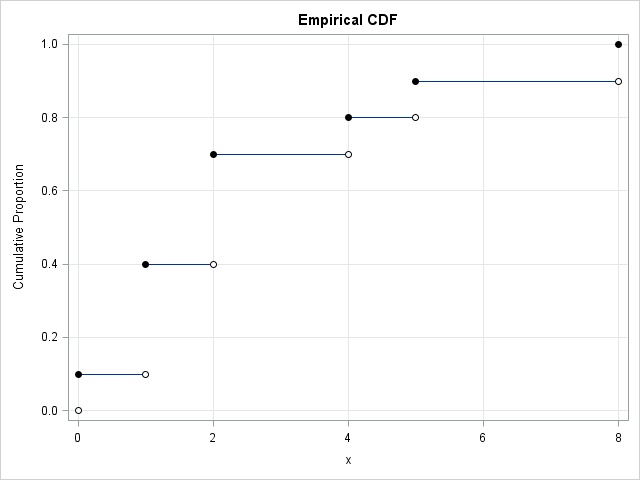
In last week's article about the Flint water crisis, I computed the 90th percentile of a small data set. Although I didn't mention it, the value that I reported is different from the the 90th percentile that is reported in Significance magazine. That is not unusual. The data only had [...] The post Quantile definitions in SAS appeared first on The DO Loop.
