Posts Tagged ‘ normal distribution ’

Exploratory Data Analysis – Kernel Density Estimation and Rug Plots in R on Ozone Data in New York and Ozonopolis

Exploratory Data Analysis – Kernel Density Estimation and Rug Plots in R on Ozone Data in New York and Ozonopolis

Update on July 15, 2013: Thanks to Harlan Nelson for noting on AnalyticBridge that the ozone concentrations for both New York and Ozonopolis are non-negative quantities, so their kernel density plot should have non-negative support sets.  This has been corrected in this post by - defining new variables called max.ozone and max.ozone2 - using the […]

Read more »

Exploratory Data Analysis: 2 Ways of Plotting Empirical Cumulative Distribution Functions in R

Exploratory Data Analysis: 2 Ways of Plotting Empirical Cumulative Distribution Functions in R

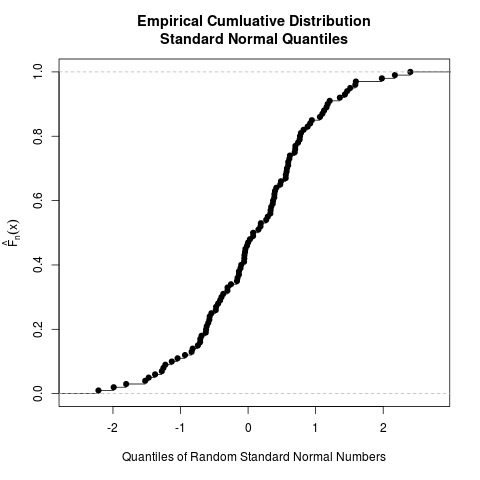
Introduction Continuing my recent series on exploratory data analysis (EDA), and following up on the last post on the conceptual foundations of empirical cumulative distribution functions (CDFs), this post shows how to plot them in R.  (Previous posts in this series on EDA include descriptive statistics, box plots, kernel density estimation, and violin plots.) I […]

Read more »

Exploratory Data Analysis: Conceptual Foundations of Empirical Cumulative Distribution Functions

Exploratory Data Analysis: Conceptual Foundations of Empirical Cumulative Distribution Functions

Introduction Continuing my recent series on exploratory data analysis (EDA), this post focuses on the conceptual foundations of empirical cumulative distribution functions (CDFs); in a separate post, I will show how to plot them in R.  (Previous posts in this series include descriptive statistics, box plots, kernel density estimation, and violin plots.) To give you […]

Read more »

Exploratory Data Analysis: Kernel Density Estimation – Conceptual Foundations

Exploratory Data Analysis: Kernel Density Estimation – Conceptual Foundations

For the sake of brevity, this post has been created from the first half of a previous long post on kernel density estimation.  This first half focuses on the conceptual foundations of kernel density estimation.  The second half will focus on constructing kernel density plots and rug plots in R. Introduction Recently, I began a […]

Read more »

Finding the Distribution Parameters

April 10, 2013
By
Finding the Distribution Parameters

This is a brief description on one way to determine the distribution of given data. There are several ways to accomplish this in R especially if one is trying to determine if the data comes from a normal distribution. Rather than focusing on hypothesis testing and determining if a distribution is actually the said distribution [...]

Read more »

Checking for Normality with Quantile Ranges and the Standard Deviation

Checking for Normality with Quantile Ranges and the Standard Deviation

Introduction I was reading Michael Trosset’s “An Introduction to Statistical Inference and Its Applications with R”, and I learned a basic but interesting fact about the normal distribution’s interquartile range and standard deviation that I had not learned before.  This turns out to be a good way to check for normality in a data set. […]

Read more »

All models are wrong

June 25, 2012
By
All models are wrong

In my title I quote George Box, who wrote,  “Essentially, all models are wrong, but some are useful“. I wish economists would remember this more often. Statistics and Operations Research (and many other sciences) are based on the concept of … Continue reading →

Read more »

Confusing Stats Terms Explained: Standard Deviation

August 1, 2010
By
Confusing Stats Terms Explained: Standard Deviation

Most people find statistics to be complicated, confusing, and just generally frustrating. One of the biggest causes of confusion is the complicated vocabulary that is associated with stats. Frankly, it sometimes seems that stats terms were made to be intentionally complicated. In fact, some concepts seem perfectly understandable when described inplain English, but seem incomprehensible when described in stats lingo.With this in mind, I decided to compile a list of…

Read more »

Data Transformations: statistical voodoo or truth serum for your data?

April 26, 2010
By

Anyone that has taken a statistics class has probably learned about transforming data, at one time or another (although you may be in denial about it). In short, you may want to transform your data if you need to perform a parametric analysis, but the inherent assumptions are violated in your dataset. While this seems simple enough, many researchers are hesitant to employ this tactic of handling non-normally distributed data.…

Read more »


Subscribe

Email:

  Subscribe