
Testing the validity of the assumption, that the errors in a regression model are normally distributed, is a standard pastime in econometrics. We use this assumption when we construct standard confidence intervals for, or test hypotheses about, t...

Testing the validity of the assumption, that the errors in a regression model are normally distributed, is a standard pastime in econometrics. We use this assumption when we construct standard confidence intervals for, or test hypotheses about, t...

I recently introduced the use of linear basis function models for supervised learning problems that involve non-linear relationships between the predictors and the target. A common type of basis function for such models is the Gaussian basis function. This type of model uses the kernel of the normal (or Gaussian) probability density function (PDF) as […]

Having taught and tutored introductory statistics numerous times, I often hear students misinterpret the Central Limit Theorem by saying that, as the sample size gets bigger, the distribution of the data approaches a normal distribution. This is not true. If your data come from a non-normal distribution, their distribution stays the same regardless of the […]

In a recent post I commented on the connection between the multivariate normal distribution and marginal distributions that are normal. Specifically, the latter do not necessarily imply the former.So, let's think about this in terms of testing for norm...

What test do you usually use if you want to test if the errors of your regression model are normally distributed? I bet it's the Jarque-Bera (1982, 1987) test. After all, it's a standard feature in pretty well every econometrics package. And with very ...

The simplest experimental design is the completely randomized design with 1 factor. In this design, each experimental unit is randomly assigned to each factor level. This design is most useful for a homogeneous population (one that does not have major differences between any sub-populations). It is appealing because of its simplicity and flexibility – it can […]
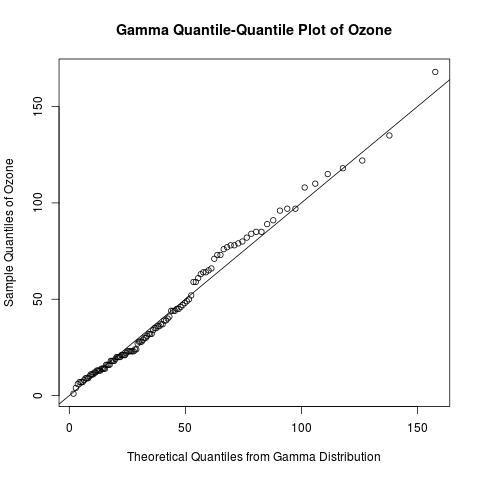
Introduction Continuing my recent series on exploratory data analysis, today’s post focuses on quantile-quantile (Q-Q) plots, which are very useful plots for assessing how closely a data set fits a particular distribution. I will discuss how Q-Q plots are constructed and use Q-Q plots to assess the distribution of the “Ozone” data from the built-in […]

Histogram: LM estimates of Intercepts Histogram: LM estimates of Gradient QQ Plot: LM estimates of Intercepts QQ Plot: LM estimates of Gradient Figure 1: Gradient appears to follow a normal distribution more than intercept . When do we use a parametric model, and when do we use a non-parametric one? In […]
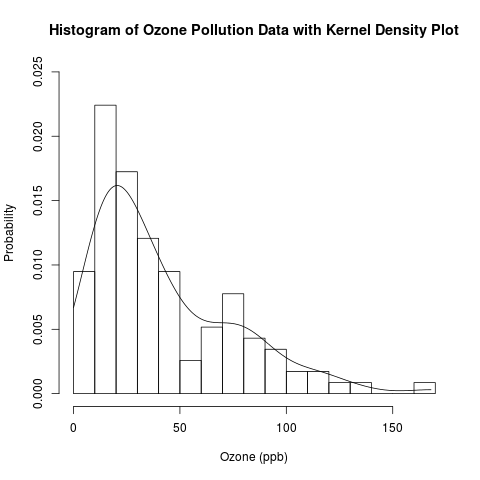
Introduction This is a follow-up post to my recent introduction of histograms. Previously, I presented the conceptual foundations of histograms and used a histogram to approximate the distribution of the “Ozone” data from the built-in data set “airquality” in R. Today, I will examine this distribution in more detail by overlaying the histogram with parametric […]

Telly monster is my favourite character on Sesame Street, and a few years ago I was lucky enough to actually meet him. This morning I was delighted to find out from my resident Sesame Street expert that Telly monster is … Continue reading →
