Posts Tagged ‘ graphics ’

Hilarious graph

September 11, 2012
By
Hilarious graph

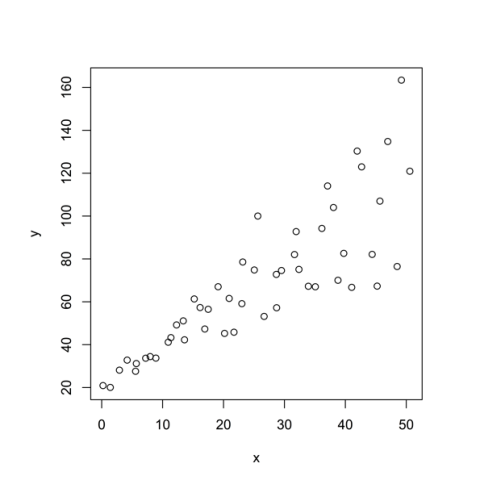
I read an interesting post on the NY Times site this morning, which said: Analyzing data from the 2008 American National Election Study, we found no relationship between negative feelings toward African-Americans and opposition to government-provided health care among whites without college degrees. For college-educated whites, however, negative racial feelings were strongly associated with increased [...]
Read more »

Near-instant high quality graphs in R

September 5, 2012
By
Near-instant high quality graphs in R

One of the main attractions of R (for me) is the ability to produce high quality graphics that look just the way you want them to. The basic plot functions are generally excellent for exploratory work and for getting to know your data. Most packages have additional functions for appropriate exploratory work or for summarizing […]

Read more »

Example 9.38: dynamite plots, revisited

July 16, 2012
By
Example 9.38: dynamite plots, revisited

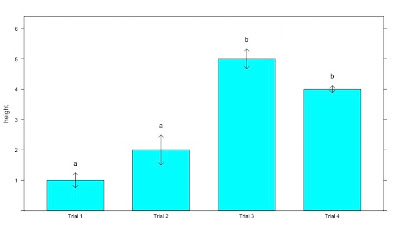
Dynamite plots are a somewhat pejorative term for a graphical display where the height of a bar indicates the mean, and the vertical line on top of it represents the standard deviation (or standard error). These displays are commonly found in many scie...

Read more »

Learning a new language

June 22, 2012
By
Learning a new language

It had been a very long time since I’d tried to learn a new programming language. I started C in 1987, S in 1992, and Perl in 1997, but nothing really new in the subsequent 15 years. A friend now has me doing D, wanting to find time to learn ruby, and, most recently, playing […]

Read more »

Interview with Amanda Cox – Graphics Editor at the New York Times

June 1, 2012
By
Interview with Amanda Cox – Graphics Editor at the New York Times

Amanda Cox  Amanda Cox received her M.S. in statistics from the University of Washington in 2005. She then moved to the New York Times, where she is a graphics editor. She, and the graphics team at the New York Times, are responsible for many of th...

Read more »

Interview with Amanda Cox – Graphics Editor at the New York Times

June 1, 2012
By
Interview with Amanda Cox – Graphics Editor at the New York Times

Amanda Cox  Amanda Cox received her M.S. in statistics from the University of Washington in 2005. She then moved to the New York Times, where she is a graphics editor. She, and the graphics team at the New York Times, are responsible for many of th...

Read more »

Microarrays suck

April 25, 2012
By
Microarrays suck

Maybe it’s just that I’m stupid and haven’t been paying proper attention to Rafa’s work in the past decade, but microarray data have really been kicking my ass the last few weeks. Here are a few of the lessons that I’ve re-learned. Lesson 1: What the hell is that? Many (or all) of my interesting [...]

Read more »

How do I know if my figure is too complicated?

April 25, 2012
By

One of the key things every statistician needs to learn is how to create informative figures and graphs. Sometimes, it is easy to use off-the-shelf plots like barplots, histograms, or if one is truly desperate a pie-chart.  But sometimes the informat...

Read more »

Resampling Hierarchically Structured Data Recursively

April 4, 2012
By
Resampling Hierarchically Structured Data Recursively

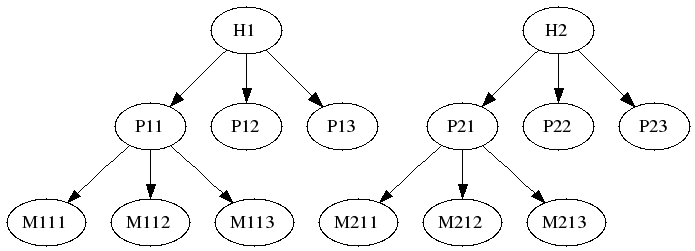
That's a mouthful! I presented this topic to a group of Vandy statisticians a few days ago. My notes (essentially reproduced in this post) are recorded at the Dept. of Biostatistics wiki: HowToBootstrapCorrelatedData. The presentation covers some bootstrap strategies for hierarchically structured (correlated) data, but focuses on the multi-stage bootstrap; an extension of that described [...]

Read more »

Example 9.25: It’s been a mighty warm winter? (Plot on a circular axis)

April 2, 2012
By
Example 9.25: It’s been a mighty warm winter? (Plot on a circular axis)

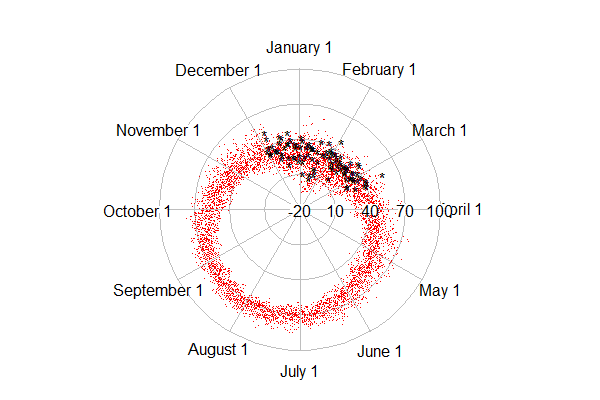
Updated (see below)People here in the northeast US consider this to have been an unusually warm winter. Was it?The University of Dayton and the US Environmental Protection Agency maintain an archive of daily average temperatures that's reasonably curr...

Read more »

Subscribe

Email:

  Subscribe