Posts Tagged ‘ graphics ’

Example 10.8: The upper 95% CI is 3.69

December 10, 2012
By
Example 10.8: The upper 95% CI is 3.69

Apologies for the long and unannounced break-- the longest since we started blogging, three and a half years ago. I was writing a 2-day course for SAS users to learn R. Contact me if you're interested. And Nick and I are beginning work on the second...

Read more »

Fun with R graphics: A raptor and a cake

November 15, 2012
By
Fun with R graphics: A raptor and a cake

I like to explore the graphics features of R.  Base graphics, ggplot2 are my favourites. On  other graphics packages, I haven’t used plotrix much. I am currently exploring grid package. Raptor First one is using ggplot2. (you could also do this using base graphics). [crayon-523ebbb59f714484264342/] It would be more fun if we can do animation […]The post Fun with R graphics: A raptor and a cake appeared first on Fiddling…

Read more »

Informative Graphics on Taxes and the Economy

November 2, 2012
By
Informative Graphics on Taxes and the Economy

The nonpartisan Congressional Research Service0 made news1 when a report the service had prepared was withdrawn due to pressure from Republican leaders. The report - titled Taxes and the Economy: An Economic Analysis of the Top Tax Rates Since 19452,3 - addressed some of the evidence for the association between tax rates and economic growth, [...]

Read more »

LaTeX loops

October 23, 2012
By
LaTeX loops

Today I was writing a report which included 20 figures, with the names demandplot1.pdf, demandplot2.pdf, …, demandplot20.pdf, and all with similar captions. Clearly a loop was required. After all, LaTeX is a programming language, so we should be able to take advantage of its capabilities. I found the forloop package which handled the problem perfectly. My first attempt looked like this: \newcommand{\demandplot}[1]{\begin{figure}\centering \includegraphics[width=\textwidth]{./figs/demandplot#1.pdf} \caption{Hourly demand (GW) for zone #1.} \end{figure}}…

Read more »

Curved arrows in R

October 11, 2012
By
Curved arrows in R

I briefly investigated how to draw curved arrows in R. Here’s a small piece of the figure that I ultimately created: A google search for “curved arrows in R” revealed three options: curvedarrow in the diagram package The internal function igraph.Arrows within the igraph package (mentioned by Gabor Csardi in R help) Using xspline for […]

Read more »

The Young Stats Communication Challenge

October 7, 2012
By
The Young Stats Communication Challenge

The Australian Young Statisticians Conference (Feb 2013) is organizing a communication competition. They invite all early-career statisticians (studying, or within 5 years of graduation) to produce a short (3–5 minute) video for the ABS YSC2013 Video...

Read more »

2-D author lists

October 3, 2012
By

The order of authors on scientific papers matters a lot. The best places to be on a paper vary by field. But typically the first and the corresponding (usually last) authors are the prime real estate. When people are evaluated on the job market, for pr...

Read more »

Odd smoother

September 27, 2012
By
Odd smoother

I was flipping though the contents of G3 and saw this paper, which includes Jim Cheverud as an author. I poked through the paper, and my eye was attracted to the following figure. These are supposed to be functions, but some weird smoother was used,...

Read more »

R Graphics with ggplot2

September 18, 2012
By
R Graphics with ggplot2

ggplot2 is one of the most elegant R package for data analysis and visualization.  Recently I gave a tutorial on ggplot2 package.  You could find my ggplot2 notes here(click the image below). You could find my presentation slide below. The presentat...

Read more »

Example 10.2: Custom graphic layouts

September 17, 2012
By
Example 10.2: Custom graphic layouts

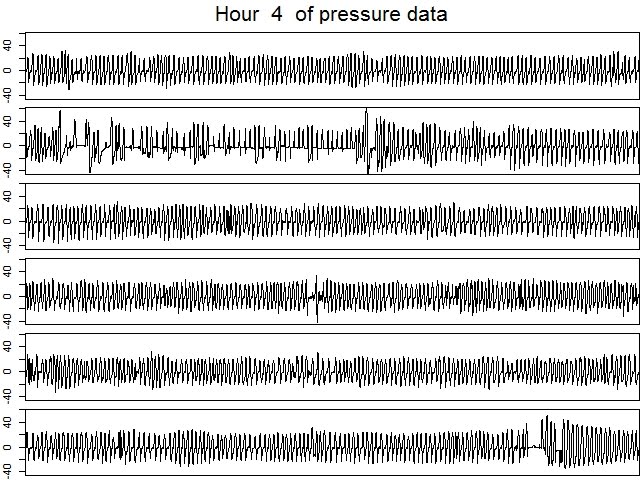
In example 10.1 we introduced data from a CPAP machine. In brief, it's hard to tell exactly what's being recorded in the data set, but it seems to be related to the pattern of breathing. Measurements are taken five times a second, leading to on the o...

Read more »

Subscribe

Email:

  Subscribe