Posts Tagged ‘ plots ’

"To Pie or Not To Pie" That is the question! Graph theory

March 2, 2016
By
"To Pie or Not To Pie" That is the question! Graph theory

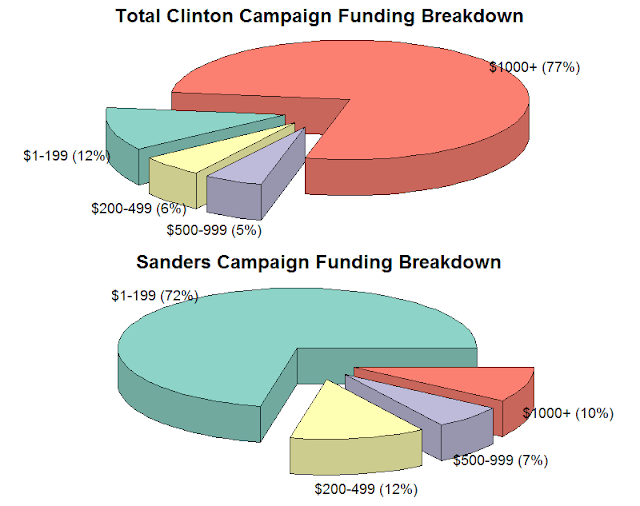
In several recent posts I have attempted to convey the nature of how the current primary season is funded (on the Democratic side). In order to assist in conveying this information I have employed several different analytical angles and graphical strat...
Read more »

Potato Chips and ANOVA, Part 2: Using Analysis of Variance to Improve Sample Preparation in Analytical Chemistry

Potato Chips and ANOVA, Part 2: Using Analysis of Variance to Improve Sample Preparation in Analytical Chemistry

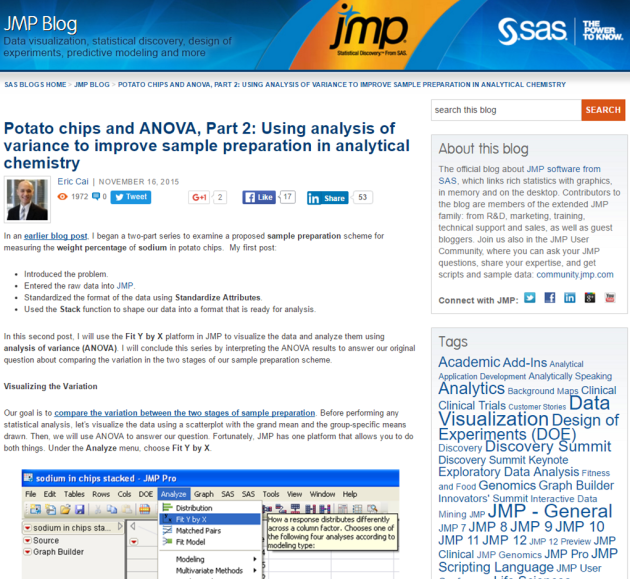
In this second article of a 2-part series on the official JMP blog, I use analysis of variance (ANOVA) to assess a sample-preparation scheme for quantifying sodium in potato chips.  I illustrate the use of the “Fit Y by X” platform in JMP to implement ANOVA, and I propose an alternative sample-preparation scheme to obtain […]

Read more »

Using and Producing a Control Chart in R for Statistical Process Control – An Application in Analytical Chemistry

Using and Producing a Control Chart in R for Statistical Process Control – An Application in Analytical Chemistry

Update on Wednesday, August 5, 2015: I am considering retracting this blog post based on my disagreement with Daniel Harris’ approach to building the warning and action lines in a control chart.  Please see my replies to Jake Yeager and Lee Kennedy in the comments section for my thoughts.  Your patience is appreciated; please stay […]

Read more »

Exploratory Data Analysis – All Blog Posts on The Chemical Statistician

Exploratory Data Analysis – All Blog Posts on The Chemical Statistician

This series of posts introduced various methods of exploratory data analysis, providing theoretical backgrounds and practical examples.  Fully commented and readily usable R scripts are available for all topics for you to copy and paste for your own analysis!  Most of these posts involve data visualization and plotting, and I include a lot of detail and […]

Read more »

Exploratory Data Analysis – All Blog Posts on The Chemical Statistician

Exploratory Data Analysis – All Blog Posts on The Chemical Statistician

This series of posts introduced various methods of exploratory data analysis, providing theoretical backgrounds and practical examples.  Fully commented and readily usable R scripts are available for all topics for you to copy and paste for your own analysis!  Most of these posts involve data visualization and plotting, and I include a lot of detail and […]

Read more »

One datavis for you, ten for me

September 14, 2014
By
One datavis for you, ten for me

Over the years of my graduate studies I made a lot of plots. I mean tonnes. To get an extremely conservative estimate I grep’ed for every instance of “plot\(” in all of the many R scripts I wrote over the past five years. The actual number is very likely orders of magnitude larger as 1) many […]

Read more »

Determining chemical concentration with standard addition: An application of linear regression in JMP – A Guest Blog Post for the JMP Blog

Determining chemical concentration with standard addition: An application of linear regression in JMP – A Guest Blog Post for the JMP Blog

I am very excited to announce that I have been invited by JMP to be a guest blogger for its official blog!  My thanks to Arati Mejdal, Global Social Media Manager for the JMP Division of SAS, for welcoming me into the JMP blogging community with so much support and encouragement, and I am pleased to […]

Read more »

Side-by-Side Box Plots with Patterns From Data Sets Stacked by reshape2 and melt() in R

Side-by-Side Box Plots with Patterns From Data Sets Stacked by reshape2 and melt() in R

Introduction A while ago, one of my co-workers asked me to group box plots by plotting them side-by-side within each group, and he wanted to use patterns rather than colours to distinguish between the box plots within a group; the publication that will display his plots prints in black-and-white only.  I gladly investigated how to […]

Read more »

Rectangular Integration (a.k.a. The Midpoint Rule) – Conceptual Foundations and a Statistical Application in R

Rectangular Integration (a.k.a. The Midpoint Rule) – Conceptual Foundations and a Statistical Application in R

Introduction Continuing on the recently born series on numerical integration, this post will introduce rectangular integration.  I will describe the concept behind rectangular integration, show a function in R for how to do it, and use it to check that the distribution actually integrates to 1 over its support set.  This post follows from my […]

Read more »

Trapezoidal Integration – Conceptual Foundations and a Statistical Application in R

Trapezoidal Integration – Conceptual Foundations and a Statistical Application in R

Introduction Today, I will begin a series of posts on numerical integration, which has a wide range of applications in many fields, including statistics.  I will introduce trapezoidal integration by discussing its conceptual foundations, write my own R function to implement trapezoidal integration, and use it to check that the Beta(2, 5) probability density function […]

Read more »


Subscribe

Email:

  Subscribe