Posts Tagged ‘ history ’

ISOTYPE Book: Mackenzie, The Vital Flame

January 18, 2017
By
ISOTYPE Book: Mackenzie, The Vital Flame

The first book in the new series on ISOTYPE books is The Vital Flame by Compton Mackenzie, published by The British Gas Council in 1947. It contains 42 color photographs and five ISOTYPE charts, with a nice variety of different topics and styles. A Bit of Context My copy of the book came with a […]

Read more »

New Series: ISOTYPE Books

January 16, 2017
By
New Series: ISOTYPE Books

Presenting facts through data is not a recent idea. Otto and Marie Neurath created ISOTYPE in the 1920s and then ran their ISOTYPE Institute for more than two decades. During that time, they created charts for a wide variety of publications. In this series, I will show a number of these charts that I have […]

Read more »

Discover power laws by log-transforming data

December 5, 2016
By
Discover power laws by log-transforming data

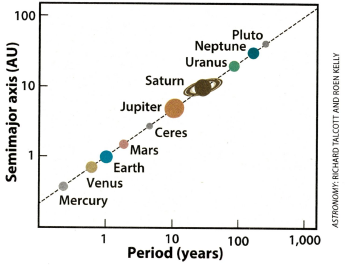
A recent issue of Astronomy magazine mentioned Kepler's third law of planetary motion, which states "the square of a planet's orbital period is proportional to the cube of its average distance from the Sun" (Astronomy, Dec 2016, p. 17). The article included a graph (shown at the right) that shows […] The post Discover power laws by log-transforming data appeared first on The DO Loop.

Read more »

20 Years Ago

September 1, 2016
By
20 Years Ago

1996 On the 2nd of September 1996, Statistics Switzerland published its brand-new website, www.bfs.admin.ch. It was one of the first (if not the first) of the Swiss Administration (www.admin.ch). In three languages… … and already with quite rich structure and content. The Wayback Machine … … shows the developments since 1996 https://archive.org/web/. 1996: Handmade with Frontpage … Continue reading 20 Years Ago

Read more »

The Repetitive and Boring History of Visualization

August 15, 2016
By
The Repetitive and Boring History of Visualization

When people talk about the history of data visualization, the same set of names always comes up: Playfair, Nightingale, Snow, Minard. They are historically important, alright, but why do they overshadow all the other work that was done? And what do we know about how important they actually were? The Usual Suspects They’re like old […]

Read more »

The Personified User Interface Trap

April 19, 2016
By
The Personified User Interface Trap

Personified user interfaces, like chat bots or agents, are the new thing once again. But despite advances in artificial intelligence, they still have many issues and drawbacks compared to direct-manipulation interfaces. There was a debate around these interfaces in the 1990s, and it seems to be bound to repeat itself. In the last few weeks, Facebook unveiled a … Continue reading The Personified User Interface Trap

Read more »

Ye Olde Pie Chart Debate

March 15, 2016
By
Ye Olde Pie Chart Debate

You may think that the debate over pie charts was a new one, but it has raged on for at least 100 years. Brinton started it in 1914, and great drama unfolded in the pages of the Journal of the American Statistical Association in the 1920s. Willard Brinton It all started with Willard C. Brinton … Continue reading Ye Olde Pie Chart Debate

Read more »

Ahead of their Time

September 1, 2015
By
Ahead of their Time

A picture helps understanding facts  – and this since hundreds of years. Investintech presents a (very) short insight in the history of data visualisation. Playfair For visualisation of statistics, William Playfair is a very important pioneer. More about William Playfair in this blog post:      Filed under: 031 Data visualization Tagged: data, history, visualisation

Read more »

Ahead of their Time

September 1, 2015
By
Ahead of their Time

A picture helps understanding facts  – and this since hundreds of years. Investintech presents a (very) short insight in the history of data visualisation. Playfair For visualisation of statistics, William Playfair is a very important pioneer. More about William Playfair in this blog post:      Filed under: 031 Data visualization Tagged: data, history, visualisation

Read more »

More than just Numbers

August 3, 2015
By
More than just Numbers

The historical research uses statistics since ever.  And Official Statistics are a favourite source for quantitative historiography and digital humanities. ‘Statistics are more than just numbers’ Statistics New Zealand depicts the history of the capital Wellington with a popular format – an infographic. ‘In 1865, following a period of heated debate, an independent tribunal of … Continue reading More than just Numbers

Read more »


Subscribe

Email:

  Subscribe