Posts Tagged ‘ displaying means ’

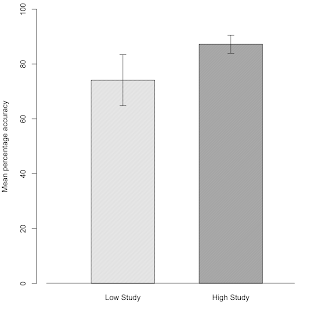
The aesthetics of error bars

May 27, 2012
By
The aesthetics of error bars

This blog and my other main blog (the companion blog for my book) are now syndicated via R-bloggers (posts tagged R only) and statsblogs.com. The latter is a relatively new blog aggregator but looks to have some interesting content. R-bloggers it quite...

Read more »

Graphing between-subject confidence intervals for ANOVA

March 19, 2012
By
Graphing between-subject confidence intervals for ANOVA

This is a quick follow up to my earlier post that discussed how to graph CIs for within-subjects (repeated measures) ANOVA designs. My forthcoming book Serious stats describes how to do this for between-subjects designs (a much simpler proble...

Read more »

Calculating and graphing within-subject confidence intervals for ANOVA

October 4, 2011
By
Calculating and graphing within-subject confidence intervals for ANOVA

Psychologists are gradually coming round to the view that it is a good idea to present interval estimates alongside point estimates of statistics. The most common statistic reported in psychology research is almost certainly the me...

Read more »

Interaction plot from cell means

February 25, 2010
By
Interaction plot from cell means

I needed to produce a few a interaction plots for my book in R and, while the interaction.plot() function is useful it has a couple of drawbacks. First, the default output isn't very pretty. Second, it works from the raw data, whereas I often need plot...

Read more »


Subscribe

Email:

  Subscribe