Posts Tagged ‘ density ’

approximate lasso

October 2, 2016
By
approximate lasso

Here is a representation of the precision of a kernel density estimate (second axis) against the true value of the density (first axis), which looks like a lasso of sorts, hence the title. I am not sure this tells much, except that the estimated values are close to the true values and that a given […]
Read more »

Copula Density Estimation

April 19, 2014
By

The joint paper, written with Gery Geenens and Davy Paindaveine, entitled “Probit transformation for nonparametric kernel estimation of the copula density” is now online on http://arxiv.org/abs/1404.4414 “Copula modelling has become...

Read more »

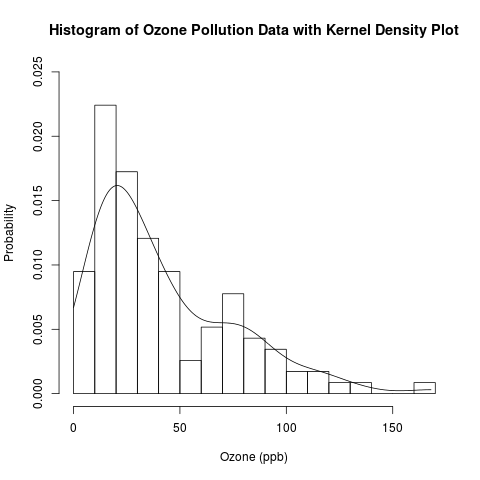
Exploratory Data Analysis: Combining Histograms and Density Plots to Examine the Distribution of the Ozone Pollution Data from New York in R

Exploratory Data Analysis: Combining Histograms and Density Plots to Examine the Distribution of the Ozone Pollution Data from New York in R

Introduction This is a follow-up post to my recent introduction of histograms.  Previously, I presented the conceptual foundations of histograms and used a histogram to approximate the distribution of the “Ozone” data from the built-in data set “airquality” in R.  Today, I will examine this distribution in more detail by overlaying the histogram with parametric […]

Read more »

Exploratory Data Analysis – Kernel Density Estimation and Rug Plots in R on Ozone Data in New York and Ozonopolis

Exploratory Data Analysis – Kernel Density Estimation and Rug Plots in R on Ozone Data in New York and Ozonopolis

Update on July 15, 2013: Thanks to Harlan Nelson for noting on AnalyticBridge that the ozone concentrations for both New York and Ozonopolis are non-negative quantities, so their kernel density plot should have non-negative support sets.  This has been corrected in this post by - defining new variables called max.ozone and max.ozone2 - using the […]

Read more »

Exploratory Data Analysis: Kernel Density Estimation – Conceptual Foundations

Exploratory Data Analysis: Kernel Density Estimation – Conceptual Foundations

For the sake of brevity, this post has been created from the first half of a previous long post on kernel density estimation.  This first half focuses on the conceptual foundations of kernel density estimation.  The second half will focus on constructing kernel density plots and rug plots in R. Introduction Recently, I began a […]

Read more »

True Significance of a T Statistic

December 17, 2012
By
True Significance of a T Statistic

The example is more of a statistical exercise that  shows the true significance and the density curve of simulated random normal data.  The code can be changed to generate data using either a different mean and standard deviation or a different distribution altogether. This extends the idea of estimating pi by generating random normal data to determine [...]

Read more »


Subscribe

Email:

  Subscribe