Posts Tagged ‘ data ’

A letter to reporters on the economy

August 19, 2013
By

The New York Times took over 1,000 words to tell us that Big Data won't change the economy (or is it the economists' profession?) ("Is Big Data an economic Big Dud?") I'm less pessimistic; I think the collection of vast troves of observational data is ultimately beneficial but only if (a) we set a high bar for analytics, such as requiring multiple corroborating data sources pointing to the same conclusion;…

Read more »

A letter to reporters on the economy

August 19, 2013
By

The New York Times took over 1,000 words to tell us that Big Data won't change the economy (or is it the economists' profession?) ("Is Big Data an economic Big Dud?") I'm less pessimistic; I think the collection of vast troves of observational data is ultimately beneficial but only if (a) we set a high bar for analytics, such as requiring multiple corroborating data sources pointing to the same conclusion;…
Read more »

Numbersense Pros: Avinash Kaushik

August 15, 2013
By
Numbersense Pros: Avinash Kaushik

Today, I have the honor of interviewing Avinash Kaushik, author of the bible known as Web Analytics 2.0, and a digital marketing evangelist at Google. He also has a must-read blog called Occam's Razor. Occam's Razor is a principle championed by statisticians that can be summarized as "as simple as possible but not too simple". It is a principle and therefore it also draws controversy from some quarters. Kaushik's blog…

Read more »

Attribution in online marketing: a Big Data problem

August 14, 2013
By
Attribution in online marketing: a Big Data problem

Avinash Kaushik's masterful post on the "mutli-channel attribution problem" in Web analytics is required reading for anyone seeking an understanding of what Big Data is really about. Kaushik's posts are marathons; I provide here a little background, plus some highlights from his post to save you some time. But you absolutely should read the whole thing! I will start from the elementary. Big Data is big because the Internet was…

Read more »

Exploratory Data Analysis: The 5-Number Summary – Two Different Methods in R

Exploratory Data Analysis: The 5-Number Summary – Two Different Methods in R

Introduction Continuing my recent series on exploratory data analysis (EDA), today’s post focuses on 5-number summaries, which were previously mentioned in the post on descriptive statistics in this series.  I will define and calculate the 5-number summary in 2 different ways that are commonly used in R.  (It turns out that different methods arise from […]

Read more »

Create your own fine print

August 6, 2013
By
Create your own fine print

Note: The winner of the Book Quiz Round 2 was announced on my book blog. Congratulations to the winners. You can get your own copy of Numbersense here. *** A common advice for anyone living in the U.S. is "read...

Read more »

Arresting visualization

August 1, 2013
By
Arresting visualization

Reader Steph G. didn't like the effort by WRAL (North Carolina) to visualize the demographics of protestors in Raleigh. It sounds like the citizens of NC are making their voices heard. Maybe my friends in Raleigh can give us some...

Read more »

Big Data and Marketing

August 1, 2013
By

In Chicago, I spoke about the impact of Big Data on marketing. I was going to summarize the key points here but then I noticed that Chris Rollyson has already done the work, and did a much better job than I can. Here are his copious notes. One question from the audience that I didn't address fully was the use of data in education. I got as far as the…

Read more »

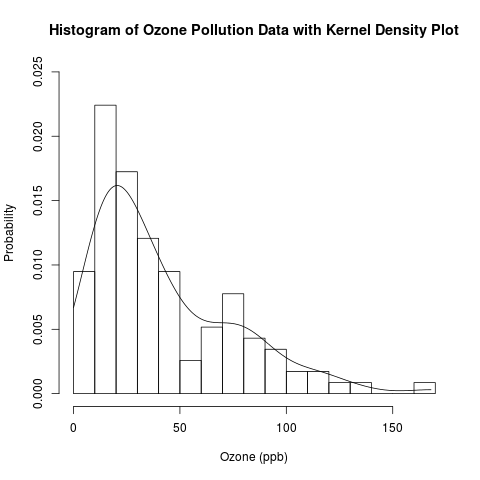
Exploratory Data Analysis: Combining Histograms and Density Plots to Examine the Distribution of the Ozone Pollution Data from New York in R

Exploratory Data Analysis: Combining Histograms and Density Plots to Examine the Distribution of the Ozone Pollution Data from New York in R

Introduction This is a follow-up post to my recent introduction of histograms.  Previously, I presented the conceptual foundations of histograms and used a histogram to approximate the distribution of the “Ozone” data from the built-in data set “airquality” in R.  Today, I will examine this distribution in more detail by overlaying the histogram with parametric […]

Read more »

Know your data 13: no-tracking technologies

July 25, 2013
By

I have been highlighting some cases of analysts doing a masterful job in taking apart claims made in the media. Here is another example from Bruce Schneier, the national security expert. In June 2013, a Who’s Who list of telecom and technology companies, such as Verizon, AT&T, Google and Facebook, was busted for passing customer data to the National Security Agency in its domestic surveillance program. This episode invites scrutiny…

Read more »

Subscribe

Email:

  Subscribe