Posts Tagged ‘ areachart ’

Replication of few graphs/charts in base R, ggplot2, and rCharts

November 7, 2013
By

UPDATE: THE BLOG/SITE HAS MOVED TO GITHUB. THE NEW LINK FOR THE BLOG/SITE IS patilv.github.io and THE LINK TO THIS POST IS: http://bit.ly/1jJ6f7v. PLEASE UPDATE ANY BOOKMARKS YOU MAY HAVE.In this post, I use a simulated dataset (7 variables -3 factor a...

Read more »

Crime Against Women in India – Addressing 8 Questions Using rCharts, googleVis, and shiny

October 5, 2013
By

UPDATE: THE BLOG/SITE HAS MOVED TO GITHUB. THE NEW LINK FOR THE BLOG/SITE IS patilv.github.io and THE LINK TO THIS POST IS: http://bit.ly/1lHtVon. PLEASE UPDATE ANY BOOKMARKS YOU MAY HAVE. Recent crimes against women, specifically the 2012 ga...

Read more »

Lilac Bloomsday Run in Graphs

July 18, 2013
By
Lilac Bloomsday Run in Graphs

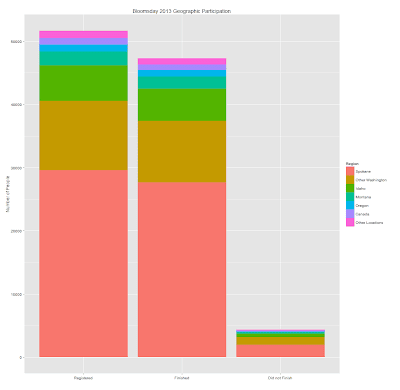
UPDATE: THE BLOG/SITE HAS MOVED TO GITHUB. THE NEW LINK FOR THE BLOG/SITE IS patilv.github.io and THE LINK TO THIS POST IS: http://bit.ly/1obWRer. PLEASE UPDATE ANY BOOKMARKS YOU MAY HAVE. The Lilac Bloomsday Run is a 7.46 miles (12 kms) rac...

Read more »


Subscribe

Email:

  Subscribe