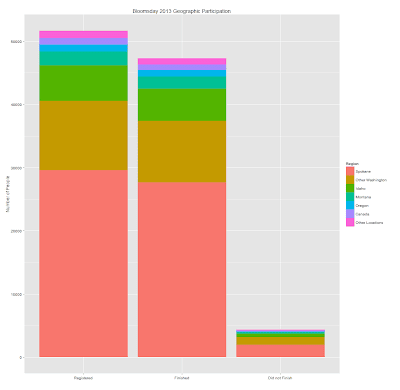
UPDATE: THE BLOG/SITE HAS MOVED TO GITHUB. THE NEW LINK FOR THE BLOG/SITE IS patilv.github.io and THE LINK TO THIS POST IS: http://bit.ly/1obWRer. PLEASE UPDATE ANY BOOKMARKS YOU MAY HAVE. The Lilac Bloomsday Run is a 7.46 miles (12 kms) rac...

UPDATE: THE BLOG/SITE HAS MOVED TO GITHUB. THE NEW LINK FOR THE BLOG/SITE IS patilv.github.io and THE LINK TO THIS POST IS: http://bit.ly/1obWRer. PLEASE UPDATE ANY BOOKMARKS YOU MAY HAVE. The Lilac Bloomsday Run is a 7.46 miles (12 kms) rac...

UPDATE: THE BLOG/SITE HAS MOVED TO GITHUB. THE NEW LINK FOR THE BLOG/SITE IS patilv.github.io and THE LINK TO THIS POST IS:http://bit.ly/1ib8wTl . PLEASE UPDATE ANY BOOKMARKS YOU MAY HAVE.This post presents a tiny slice of a complex and...

UPDATE: THE BLOG/SITE HAS MOVED TO GITHUB. THE NEW LINK FOR THE BLOG/SITE IS patilv.github.io and THE LINK TO THIS POST IS:http://bit.ly/1m1whzU . PLEASE UPDATE ANY BOOKMARKS YOU MAY HAVE.Link to the code for the analysis...

UPDATE: THE BLOG/SITE HAS MOVED TO GITHUB. THE NEW LINK FOR THE BLOG/SITE IS patilv.github.io and THE LINK TO THIS POST IS:http://bit.ly/1hguDHM . PLEASE UPDATE ANY BOOKMARKS YOU MAY HAVE.This is the last time I will talk...

UPDATE: THE BLOG/SITE HAS MOVED TO GITHUB. THE NEW LINK FOR THE BLOG/SITE IS patilv.github.io and THE LINK TO THIS POST IS:http://bit.ly/1jKxfDu . PLEASE UPDATE ANY BOOKMARKS YOU MAY HAVE.Code updated based on feedback (s...

UPDATE: THE BLOG/SITE HAS MOVED TO GITHUB. THE NEW LINK FOR THE BLOG/SITE IS patilv.github.io and THE LINK TO THIS POST IS:http://bit.ly/1nzKbdq . PLEASE UPDATE ANY BOOKMARKS YOU MAY HAVE.This is an attempt at learning an...

UPDATE: THE BLOG/SITE HAS MOVED TO GITHUB. THE NEW LINK FOR THE BLOG/SITE IS patilv.github.io and THE LINK TO THIS POST IS:http://bit.ly/1gWxlIa . PLEASE UPDATE ANY BOOKMARKS YOU MAY HAVE.Disclosure: I am not a health car...

UPDATE: THE BLOG/SITE HAS MOVED TO GITHUB. THE NEW LINK FOR THE BLOG/SITE IS patilv.github.io and THE LINK TO THIS POST IS:http://bit.ly/1vRPV8h . PLEASE UPDATE ANY BOOKMARKS YOU MAY HAVE.Data from slides on Bloomberg bus...

Data from: http://images.businessweek.com/slideshows/2012-09-26/americas-50-best-citiesThis time, I used ggplot2 to recreate the graphs created previously using Tableau. After all, R and ggplot2 are open source and free. Yes, I could leave a space...

Data from Bloomberg Businessweek's slideshow. Please click the image below to interact with it.
