Blog Archives

Visualize an ANOVA with two-way interactions

April 24, 2017
By
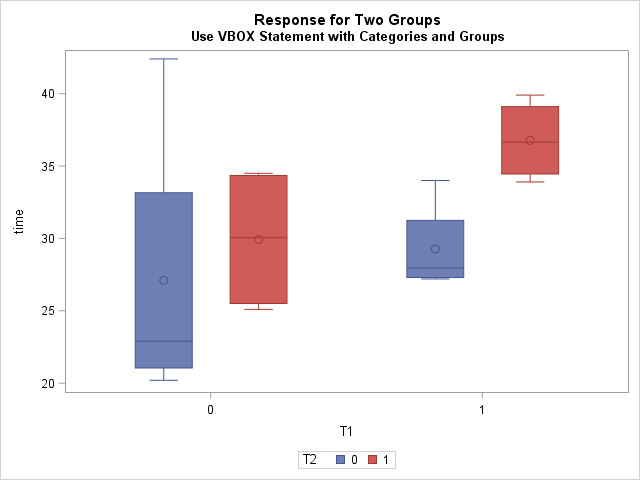
Visualize an ANOVA with two-way interactions

There are several ways to visualize data in a two-way ANOVA model. Most visualizations show a statistical summary of the response variable for each category. However, for small data sets, it can be useful to overlay the raw data. This article shows a simple trick that you can use to [...] The post Visualize an ANOVA with two-way interactions appeared first on The DO Loop.

Read more »

Regression with restricted cubic splines in SAS

April 19, 2017
By
Regression with restricted cubic splines in SAS

Restricted cubic splines are a powerful technique for modeling nonlinear relationships by using linear regression models. I have attended multiple SAS Global Forum presentations that show how to use restricted cubic splines in SAS regression procedures. However, the presenters have all used the %RCSPLINE macro (Frank Harrell, 1988) to generate [...] The post Regression with restricted cubic splines in SAS appeared first on The DO Loop.

Read more »

Visualize the 68-95-99.7 rule in SAS

April 17, 2017
By
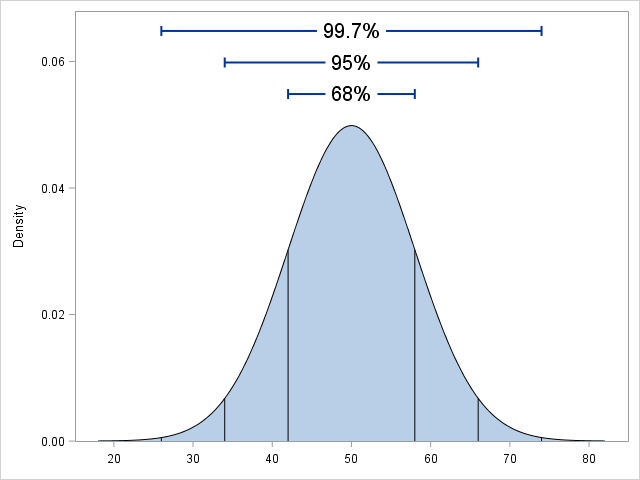
Visualize the 68-95-99.7 rule in SAS

A reader commented on last week's article about constructing symmetric intervals. He wanted to know if I created it in SAS. Yes, the graph, which illustrates the so-called 68-95-99.7 rule for the normal distribution, was created by using several statements in the SGPLOT procedure in Base SAS The SERIES statement [...] The post Visualize the 68-95-99.7 rule in SAS appeared first on The DO Loop.

Read more »

Quadratic optimization in SAS

April 12, 2017
By
Quadratic optimization in SAS

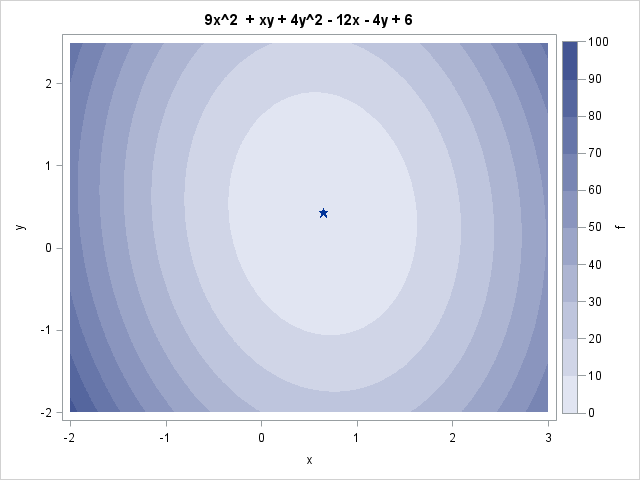
At SAS Global Forum last week, I saw a poster that used SAS/IML to optimized a quadratic objective function that arises in financial portfolio management (Xia, Eberhardt, and Kastin, 2017). The authors used the Newton-Raphson optimizer (NLPNRA routine) in SAS/IML to optimize a hypothetical portfolio of assets. The Newton-Raphson algorithm [...] The post Quadratic optimization in SAS appeared first on The DO Loop.

Read more »

A simple trick to construct symmetric intervals

April 10, 2017
By
A simple trick to construct symmetric intervals

Many intervals in statistics have the form p ± δ, where p is a point estimate and δ is the radius (or half-width) of the interval. (For example, many two-sided confidence intervals have this form, where δ is proportional to the standard error.) Many years ago I wrote an article [...] The post A simple trick to construct symmetric intervals appeared first on The DO Loop.
Read more »

Nonsmooth models and spline effects

April 5, 2017
By
Nonsmooth models and spline effects

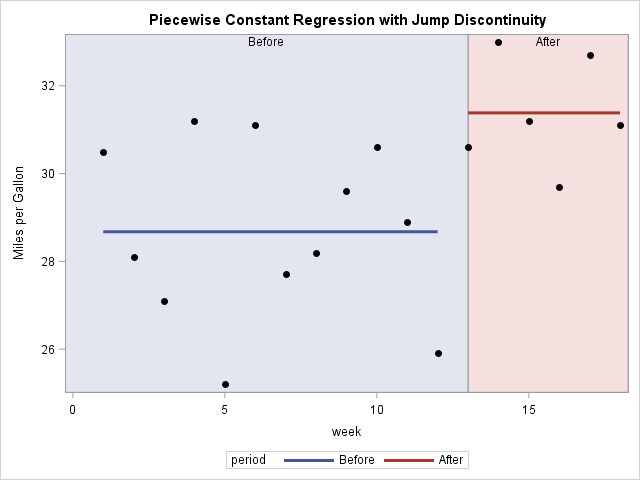
Most regression models try to model a response variable by using a smooth function of the explanatory variables. However, if the data are generated from some nonsmooth process, then it makes sense to use a regression function that is not smooth. A simple way to model a discontinuous process in [...] The post Nonsmooth models and spline effects appeared first on The DO Loop.

Read more »

Print tables in SAS/IML

April 3, 2017
By
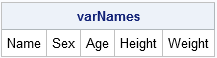
Print tables in SAS/IML

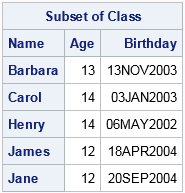
One of the advantages of the new mixed-type tables in SAS/IML 14.2 (released with SAS 9.4m4) is the greatly enhanced printing functionality. You can control which rows and columns are printed, specify formats for individual columns, and even use templates to completely customize how tables are printed. Printing a table [...] The post Print tables in SAS/IML appeared first on The DO Loop.

Read more »

Lists: Nonmatrix data structures in SAS/IML

March 29, 2017
By
Lists: Nonmatrix data structures in SAS/IML

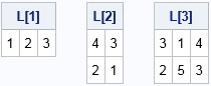
Lists are collections of objects. SAS/IML 14.2 supports lists as a way to store matrices, data tables, and other lists in a single object that you can pass to functions. SAS/IML lists automatically grow if you add new items to them and shrink if you remove items. You can also [...] The post Lists: Nonmatrix data structures in SAS/IML appeared first on The DO Loop.

Read more »

Is ODS graphics enabled? Use automatic macro variables to determine the state of SAS

March 27, 2017
By
Is ODS graphics enabled? Use automatic macro variables to determine the state of SAS

Did you know that you can check a SAS macro variable to see if ODS graphics is enabled? The other day I wanted to write a SAS program that creates a graph only if ODS graphics is enabled. The solution is to check the SYSODSGRAPHICS macro variable, which is automatically [...] The post Is ODS graphics enabled? Use automatic macro variables to determine the state of SAS appeared first on…

Read more »

Data tables: Nonmatrix data structures in SAS/IML

March 22, 2017
By
Data tables: Nonmatrix data structures in SAS/IML

Prior to SAS/IML 14.2, every variable in the Interactive Matrix Language (IML) represented a matrix. That changed when SAS/IML 14.2 (released with SAS 9.4m4) introduced two new data structures: data tables and lists. This article gives an overview of data tables. I will blog about lists in a separate article. [...] The post Data tables: Nonmatrix data structures in SAS/IML appeared first on The DO Loop.

Read more »


Subscribe

Email:

  Subscribe