Blog Archives

Example 9.36: Levene’s test for equal variances

June 25, 2012
By
Example 9.36: Levene’s test for equal variances

The assumption of equal variances among the groups in analysis of variance is an expression of the assumption of homoscedasticity for linear models more generally. For ANOVA, this assumption can be tested via Levene's test. The test is a function of ...

Read more »

Example 9.35: Discrete randomization and formatted output

June 18, 2012
By
Example 9.35: Discrete randomization and formatted output

A colleague asked for help with randomly choosing a kid within a family. This is for a trial in which families are recruited at well-child visits, but in each family only one of the children having a well-child visit that day can be in the study. The...

Read more »

Example 9.34: Bland-Altman type plot

June 5, 2012
By
Example 9.34: Bland-Altman type plot

The Bland-Altman plot is a visual aid for assessing differences between two ways of measuring something. For example, one might compare two scales this way, or two devices for measuring particulate matter. The plot simply displays the difference betw...

Read more »

Example 9.33: Multiple imputation, rounding, and bias

May 29, 2012
By
Example 9.33: Multiple imputation, rounding, and bias

Nick has a paper in the American Statistician warning about bias in multiple imputation arising from rounding data imputed under a normal assumption. One example where you might run afoul of this is if the data are truly dichotomous or count variables...

Read more »

Example 9.32: Multiple testing simulation

May 21, 2012
By
Example 9.32: Multiple testing simulation

In examples 9.30 and 9.31 we explored corrections for multiple testing and then extracting p-values adjusted by the Benjamini and Hochberg (or FDR) procedure. In this post we'll develop a simulation to explore the impact of "strong" and "weak" control...

Read more »

Example 9.31: Exploring multiple testing procedures

May 14, 2012
By
Example 9.31: Exploring multiple testing procedures

In example 9.30 we explored the effects of adjusting for multiple testing using the Bonferroni and Benjamini-Hochberg (or false discovery rate, FDR) procedures. At the time we claimed that it would probably be inappropriate to extract the adjusted p-v...

Read more »

Example 9.27: Baseball and shrinkage

April 16, 2012
By
Example 9.27: Baseball and shrinkage

To celebrate the beginning of the professional baseball season here in the US and Canada, we revisit a famous example of using baseball data to demonstrate statistical properties. In 1977, Bradley Efron and Carl Morris published a paper about the Jame...

Read more »

Example 9.26: More circular plotting

April 9, 2012
By
Example 9.26: More circular plotting

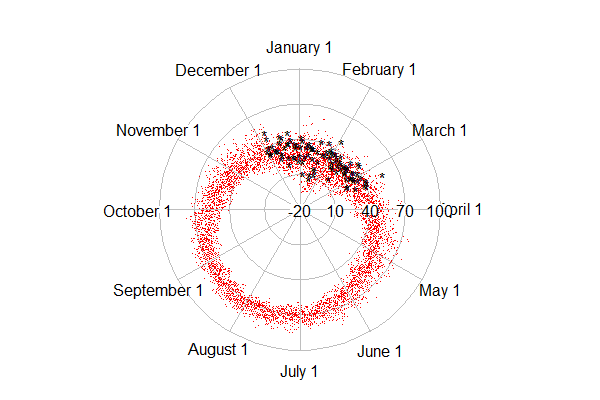
SAS's Rick Wicklin showed a simple loess smoother for the temperature data we showed here. Then he came back with a better approach that does away with edge effects. Rick's smoothing was calculated and plotted on a cartesian plane. In this entry we'...

Read more »

Example 9.25: It’s been a mighty warm winter? (Plot on a circular axis)

April 2, 2012
By
Example 9.25: It’s been a mighty warm winter? (Plot on a circular axis)

Updated (see below)People here in the northeast US consider this to have been an unusually warm winter. Was it?The University of Dayton and the US Environmental Protection Agency maintain an archive of daily average temperatures that's reasonably curr...

Read more »

Example 9.24: Changing the parameterization for categorical predictors

March 22, 2012
By
Example 9.24: Changing the parameterization for categorical predictors

In our book, we discuss the important question of how to assign different parameterizations to categorical variables when fitting models (section 3.1.3). We show code in R for use in the lm() function, as follows:lm(y ~ x, contrasts=list(x,"contr.trea...

Read more »


Subscribe

Email:

  Subscribe