
(This article was originally published at Statistical Modeling, Causal Inference, and Social Science, and syndicated at StatsBlogs.)
This post is by Bob. I have no idea what Andrew will make of these graphs; I’ve been hoping to gather enough comments from him to code up a ggplot theme. Shravan, you can move along, there’s nothing here but baseball.
Jim Albert created some great graphs for strike-count performance in a series of two blog posts. Here’s the first post:
* Jim Albert. Graphing pitch count effects (part 1)
Albert plots the pooled estimate of expected runs arising at various strike counts for all plate appearances for the 2011 season.
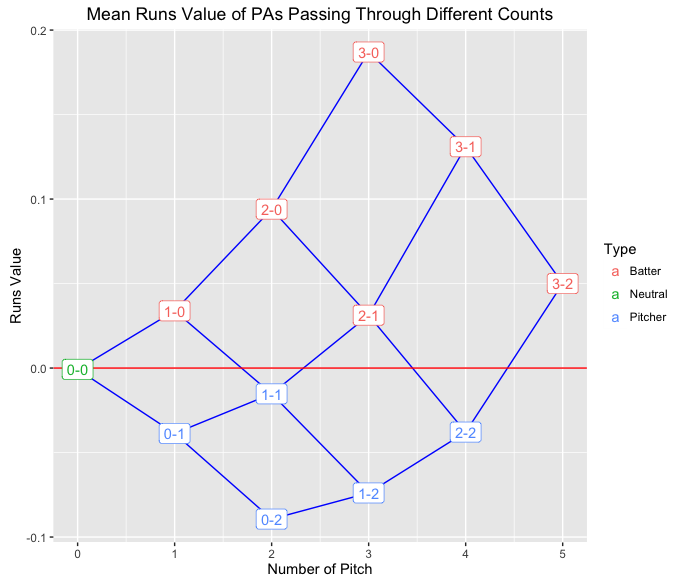
Using the x axis for count progression and the y axis for outcome yields a really nice visualization of strike count effects. I might have used arrows to really stress the state-space transitions. I might also have tried to label how often each of these transitions happened (including self-transitions at 0-2, 1-2, and 2-2 counts) and the total number of times each state came up for a batter. I don’t think we really need the double coding (color and vertical position), and indeed the coloring’s gone in the second plot.
I like the red line at the average effect for an at-bat (corresponding to a 0-0 count), but I would’ve preferred the actual expected runs on the y axis rather than something standardized to zero. The average plate appearance is worth more than 0 runs.
In the second post, Albert goes on to plot estimates by batter and pitcher without any pooling:
* Jim Albert. Graphing pitch count effects (part 2)
The following are plots for the 2015 Cy Young award winning pitchers:

He also included a couple of great batters from the same year:

With multiple graphs, it’d be nice to have the same y axis range and the same ratio of x axis to y axis size (I can never remember how to do this in ggplot). And it’d be nice to set it up so that the little bubbles don’t get truncated.
It dawned on me that the transitions are not Markovian. If a pitcher intentionally walks a batter from a 0-0 count, then the transitions from 0-0 to 1-0 to 2-0 to 3-0 are correlated. So I’d bet there are more such straight-through transitions for many batters than would be expected from Markovian transitions. We could test how well the Markovian approximation works through simulation, as Albert does for many other topics in his book Curve Ball.
Of course, the natural next step is to build a hierarchical model to partially pool the ball-strike count effects. An even more ambitious goal would be to model a particular batter vs. pitcher matchup.
I highly recommend clicking through to the original posts if you like baseball; there are many more players illustrated and much more in-depth baseball analysis.
The post Beautiful Graphs for Baseball Strike-Count Performance appeared first on Statistical Modeling, Causal Inference, and Social Science.
Please comment on the article here: Statistical Modeling, Causal Inference, and Social Science
