
(This article was originally published at Getting Genetics Done, and syndicated at StatsBlogs.)
I've analyzed some data from GEO (GSE52202) using RNA-seq to study gene expression in motor neurons differentiated from induced pluripotent stem cells (iPSCs) derived from ALS patients carrying the C9ORF72 repeat expansion. I aligned the data, counted with featureCounts, and analyzed with DESeq2. I uploaded the results to this GitHub Gist.
Here's how you can use R to create a simple volcano plot. First, download the results file here and save it as a text file called results.txt.
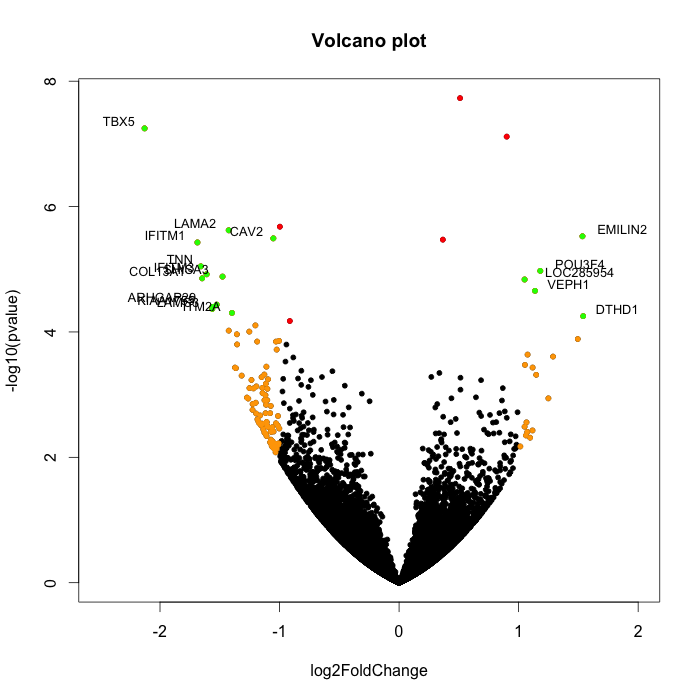
After reading in the data from GitHub the next section creates a basic volcano plot. A few more lines color the points based on their fold change and statistical significance. Finally, if you have the calibrate package installed, the last line labels a few genes of interest.
Please comment on the article here: Getting Genetics Done
