
(This article was originally published at Econometrics by Simulation, and syndicated at StatsBlogs.)
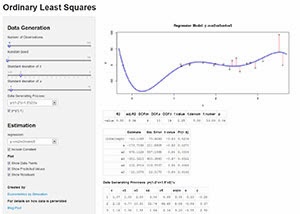 Ordinary least squares continues to be the staple estimator for causal inference for good reason. In order to help new and veteran OLS users get a better sense of how it is working I have created a shiny app that allows for instant interactivity returning coefficient estimates and prediction graphs through Shiny's easy to use user interface controls.
The app only has a single x variable which is randomly drawn from a normal distribution with mean 2 and standard deviation specified by the user. There is also an error term u which has mean 0 and standard deviation specified by the user.
The user also has control of how many observations to generate and how to generate the dependent variable y.
To play around with the app go to: econometricsbysimulation.shinyapps.io/OLS-App/
Source can be found on GitHub: github.com/EconometricsBySimulation/OLS-demo-App/
Please comment on the article here: Econometrics by Simulation
