
(This article was originally published at Statistical Modeling, Causal Inference, and Social Science, and syndicated at StatsBlogs.)
Following up on our recent discussion of visually-weighted displays of uncertainty in regression curves, Lucas Leeman sent in the following two graphs:
First, the basic spaghetti-style plot showing inferential uncertainty in the E(y|x) curve:
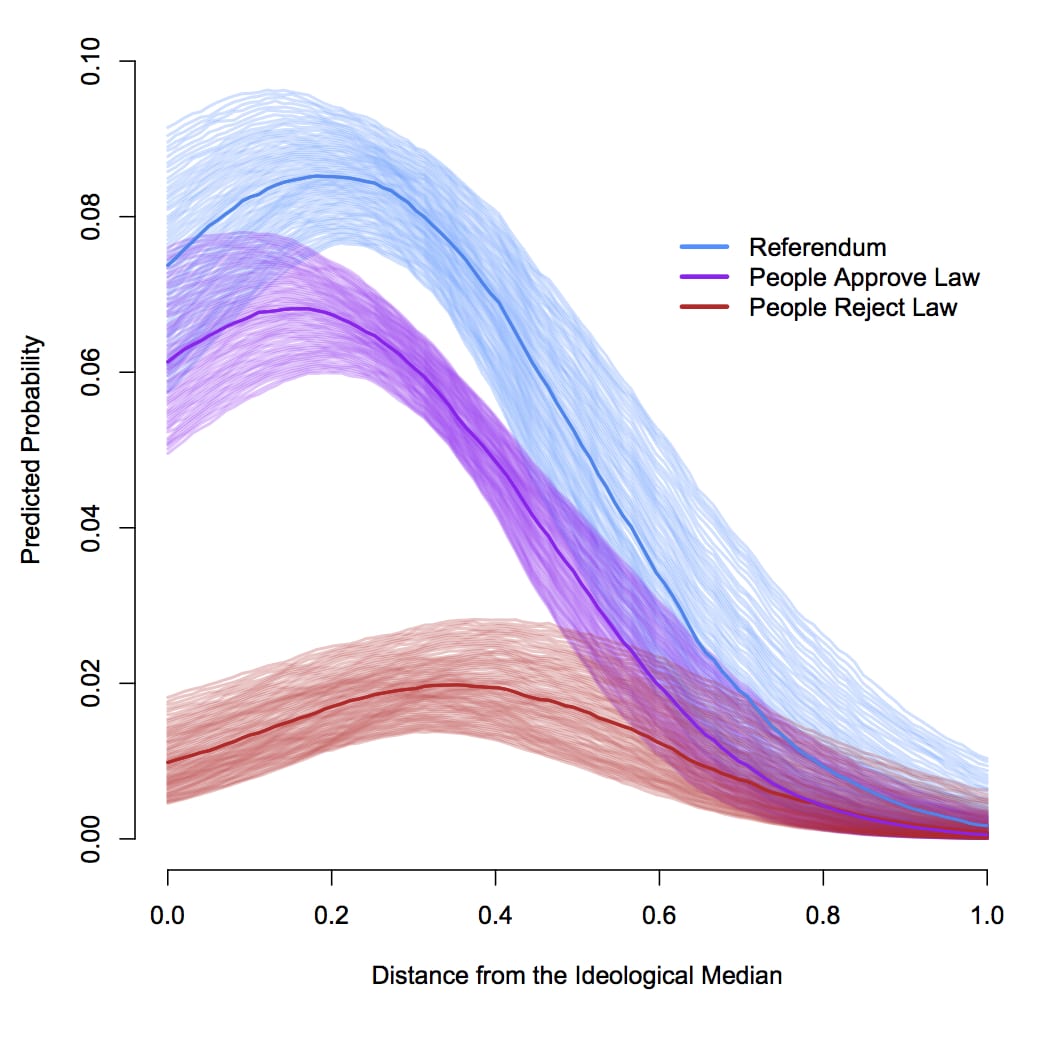
Then, a version using even lighter intensities for the lines that go further from the center, to further de-emphasize the edges:

P.S. More (including code!) here.
Please comment on the article here: Statistical Modeling, Causal Inference, and Social Science
